TraffiDent: A Dataset for Understanding the Interplay Between Traffic Dynamics and Incidents
1King Abdullah University of Science and Technology, Saudi Arabia
2University of Cologne, Germany
3Tsinghua University, China
4Institute of Automation, Chinese Academy of Sciences, China
5Vienna University of Technology, Austria
6University of Notre Dame, USA
Dataset Description:
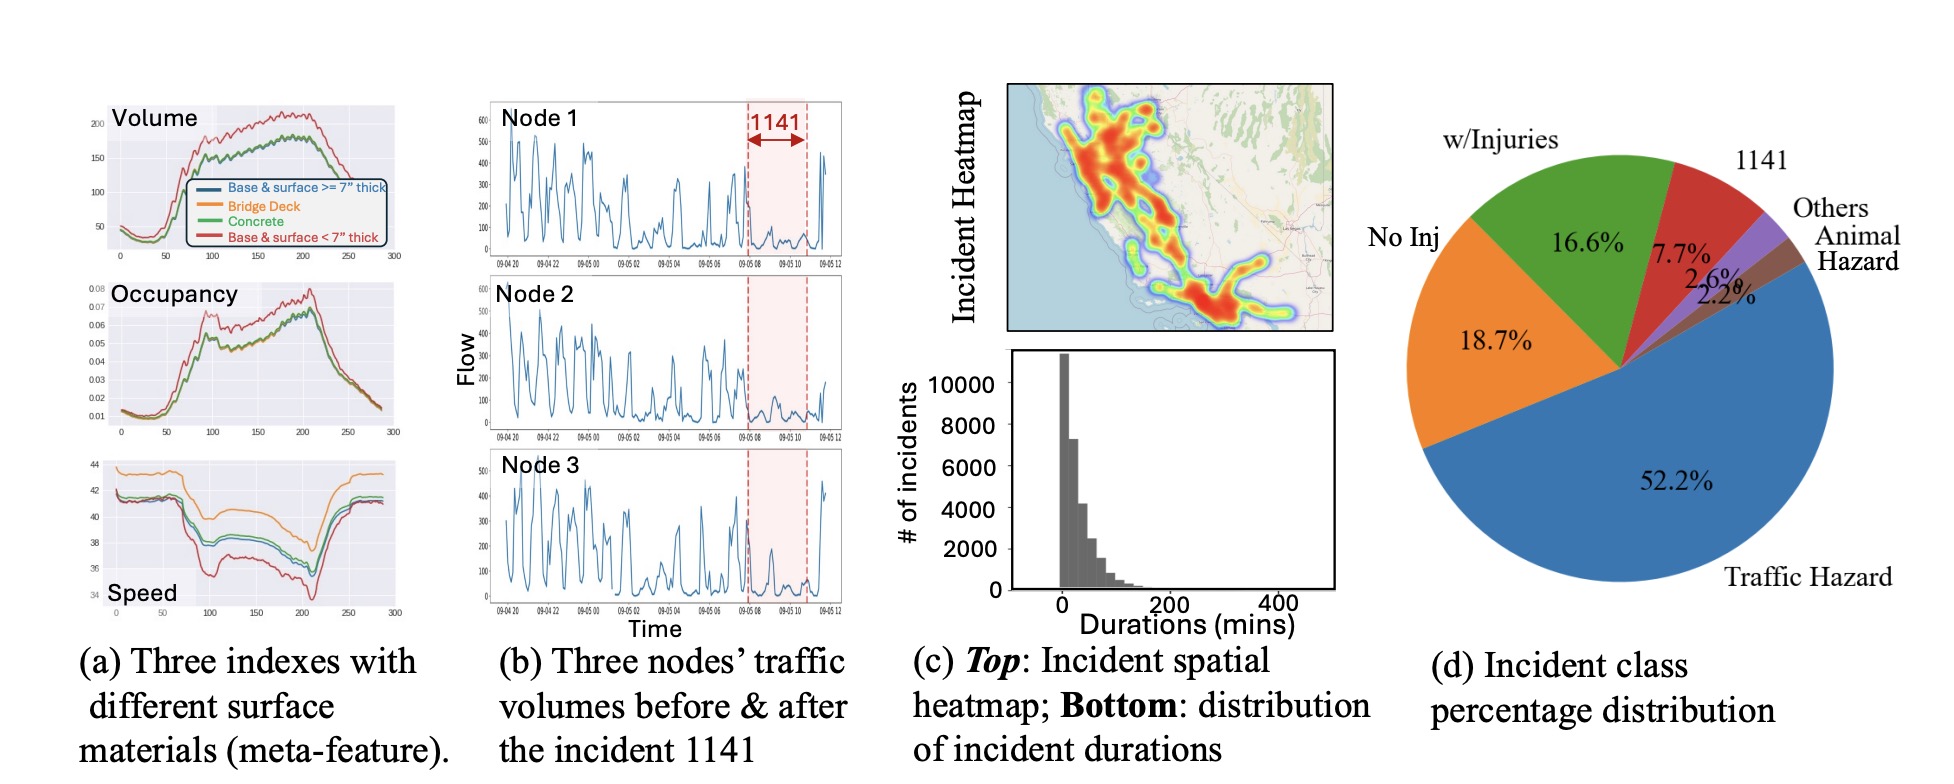
Historically, research in traffic and incidents has proceeded along two distinct but intrinsically linked tracks. The traffic domain has focused on enhancing deep learning models to incrementally improve prediction accuracy, while the incident track has predominantly concentrated on isolated studies of incident risks and patterns. For the first time, our TraffiDent dataset integrates these two tracks both spatially and temporally across a comprehensive regional scale, encompassing 16,972 traffic nodes for the entire year of 2023. The dataset includes detailed time-series data on traffic flow, lane occupancy, and average vehicle speed, as well as meticulously aligned records of incidents across seven different classes, synchronized with the traffic data. Each node also features extensive physical and policy-level meta-attributes of lanes.
Data Croissant File:
You can download the croissant of TraffiDent from here.
Descriptive Analysis

Experiments
Traffic Forecasting
Traffic forecasting is the task of predicting future traffic conditions, such as traffic volumes, speeds, and occupancy rates, at various locations within a transportation network using historical traffic data and other relevant factors.
| Test | Model | 5 Mins (t=1) | 15 Mins (t=3) | 30 Mins (t=6) | ||||||
|---|---|---|---|---|---|---|---|---|---|---|
| MAE | MAPE | RMSE | MAE | MAPE | RMSE | MAE | MAPE | RMSE | ||
| General | LSTM | 12.58 | 11.81 | 21.45 | 15.41 | 14.21 | 26.29 | 18.68 | 18.03 | 31.54 |
| ASTGCN | 12.45 | 13.11 | 20.90 | 14.59 | 13.66 | 23.10 | 16.03 | 15.56 | 27.82 | |
| DCRNN | 11.90 | 11.82 | 20.47 | 13.41 | 12.92 | 23.79 | 14.84 | 14.32 | 26.74 | |
| AGCRN | 12.54 | 12.56 | 22.65 | 13.55 | 13.18 | 25.27 | 14.62 | 14.24 | 27.92 | |
| GWNET | 11.99 | 11.85 | 20.30 | 13.53 | 12.87 | 23.44 | 14.88 | 14.15 | 26.05 | |
| STGODE | 12.75 | 13.26 | 21.66 | 14.12 | 14.57 | 24.64 | 15.50 | 16.34 | 27.43 | |
| DSTAGNN | 13.18 | 12.15 | 21.93 | 16.37 | 18.82 | 27.41 | 19.99 | 19.97 | 33.73 | |
| D2STGNN | 12.18 | 12.00 | 21.30 | 13.48 | 13.20 | 24.30 | 14.90 | 14.27 | 27.28 | |
| Incident | LSTM | 14.17 | 10.13 | 23.75 | 17.41 | 15.38 | 29.43 | 20.93 | 14.33 | 34.05 |
| ASTGCN | 14.06 | 10.55 | 23.22 | 16.42 | 15.06 | 27.63 | 18.40 | 12.59 | 30.48 | |
| DCRNN | 13.62 | 9.86 | 23.04 | 15.36 | 14.35 | 26.73 | 16.92 | 11.69 | 29.38 | |
| AGCRN | 14.48 | 10.98 | 25.41 | 15.96 | 14.78 | 28.78 | 17.21 | 11.78 | 31.42 | |
| GWNET | 13.73 | 10.44 | 22.90 | 15.60 | 14.50 | 26.73 | 17.15 | 11.49 | 29.07 | |
| STGODE | 14.50 | 10.71 | 24.49 | 16.20 | 15.19 | 27.69 | 17.55 | 12.29 | 30.17 | |
| DSTAGNN | 14.79 | 10.57 | 24.22 | 18.24 | 17.91 | 30.48 | 21.95 | 15.38 | 35.67 | |
| D2STGNN | 13.73 | 10.05 | 23.30 | 15.51 | 14.22 | 27.29 | 17.03 | 11.46 | 30.23 | |
Incident Analysis
Incident classification is the task of identifying and categorizing incidents, such as accidents or hazards, based on the analysis of traffic time series data from a specific road segment.
| Methods | Speed channel-only | Occupancy channel-only | Flow channel-only | All channels mixed | ||||||||
|---|---|---|---|---|---|---|---|---|---|---|---|---|
| Acc | Precision | Recall | Acc | Precision | Recall | Acc | Precision | Recall | Acc | Precision | Recall | |
| DT | 41.6% | 41.5% | 41.5% | 40.4% | 40.2% | 40.2% | 39.4% | 39.3% | 39.3% | 41.6% | 41.4% | 41.5% |
| TS2Vec | 36.6% | 36.2% | 36.2% | 36.6% | 36.5% | 36.4% | 37.3% | 37.0% | 37.0% | 37.3% | 37.0% | 37.0% |
| gMLP | 41.3% | 41.2% | 41.1% | 38.4% | 38.3% | 38.3% | 37.3% | 37.2% | 37.2% | 41.6% | 41.5% | 41.5% |
| Sequencer | 35.8% | 35.8% | 35.6% | 35.6% | 35.3% | 35.2% | 34.1% | 33.9% | 33.9% | 40.3% | 40.2% | 40.2% |
| OmniScaleCNN | 35.7% | 35.1% | 35.1% | 36.9% | 36.3% | 36.3% | 37.0% | 36.8% | 36.8% | 40.9% | 40.8% | 40.8% |
| PatchTST | 38.3% | 38.1% | 38.1% | 39.0% | 38.6% | 38.7% | 39.5% | 39.3% | 39.3% | 39.4% | 39.4% | 39.3% |
| FormerTime | 35.9% | 31.0% | 33.4% | 41.0% | 41.1% | 40.8% | 37.8% | 38.2% | 37.3% | 40.5% | 40.5% | 40.1% |
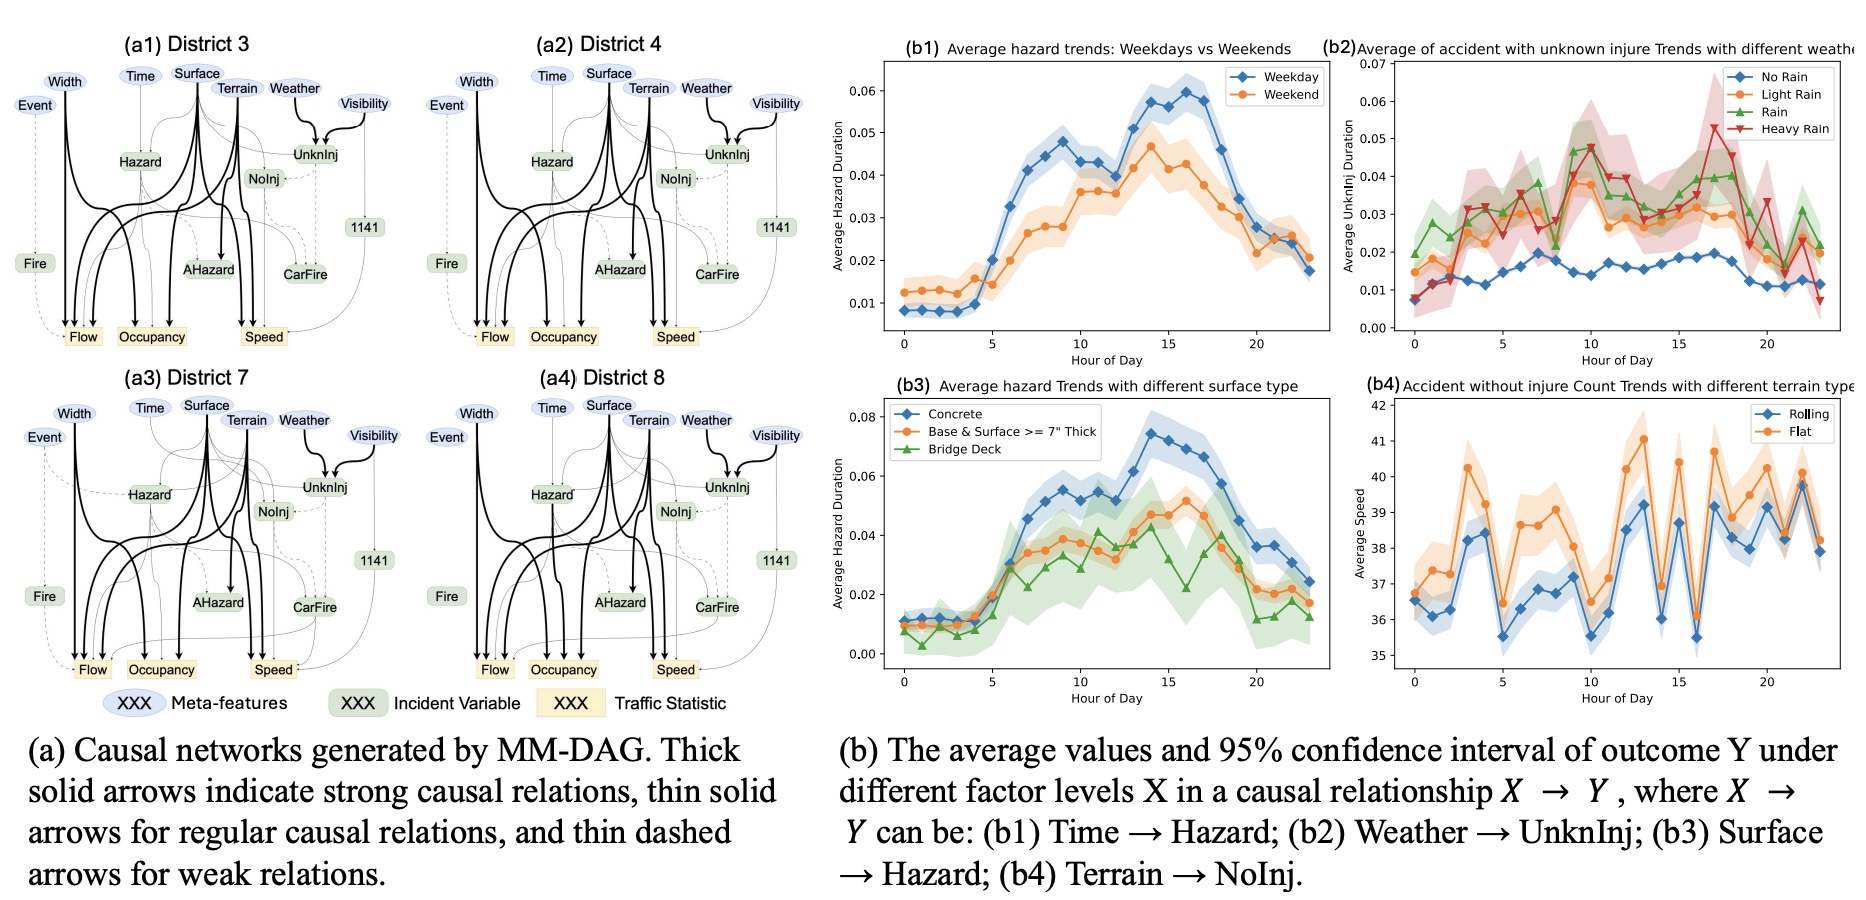
Global Causal Analysis with Meta Data
We learned the DAG among meta-features, incidents, and traffic indexes. Also, we give a factual explanation for selected edges.

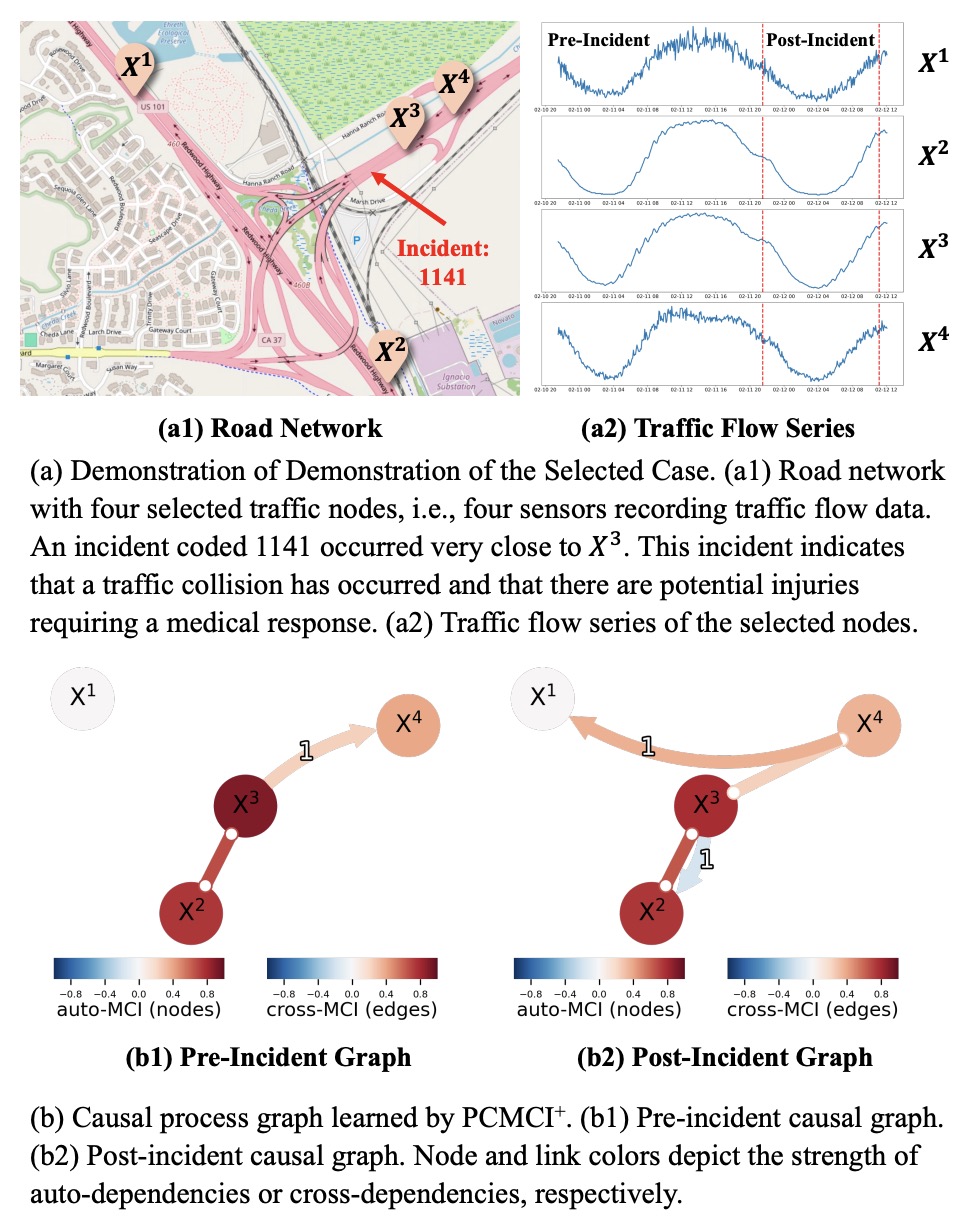
Local Causal Analysis
We conduct local causal analysis on a real case from TraffiDent

Additional Information
Dataset License: Attribution-NonCommercial 4.0 International (CC BY-NC 4.0)
Code License: MIT
Paper Citation
Upcoming soon...